Kansas City Demographics
 Ehrhardt Clinical Research serves the entire Kansas City metro area which covers a bi-state region in Missouri and Kansas of about 2 million in population.
Kansas City ranks
- 15th among the best cities to live according to Bloomberg
- 3rd among the “Best Cities for Relocating Families” in the United States according to Worldwide ERC and Primary Relocation in 2007
- 35th among “Top 50 (United States) Cities for Global Trade”
- Among Top 10 Cities for New College Graduates as published in Forbes
- As one of only two metro areas to have two cities in the top 15 best places to live in the United States in 2010 according to Money Magazine: Overland Park, Kansas, 7th, and Olathe, Kansas, 11th. Three other cities in the metro ranked in the top 50: Lee’s Summit, Missouri 27th best, and Shawnee, Kansas, 39th best, and Blue Springs, Missouri was rated 49th best.
According to ThinkKC ‘s statistics on the Kansas City metro
- The annual per household income is $71,141
- Per capita income is $28,262
- Median home price in Kansas City is $131,300
- The average age is 36.1
- 90.4% of KC residents have a high school education
- 32.8% of KC residents have a college degree
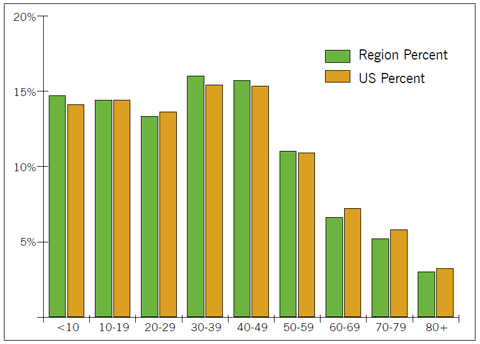
Kansas City’s demographics reflect the diversity of the United States as a whole
| KC Percent | US Percent | |
| White, Non-Hispanic | 76.3% | 67.4% |
| Black, Non-Hispanic | 13.12% | 12.2% |
| Hispanic/Latino | 6.5% | 14.1% |
| Asian | 2.0% | 4.1% |
| Two or more races, Non-Hispanic | 1.5% | 1.3% |
| American Indian | 0.4% | 0.8% |
| Native Hawaiian/Pacific Islander | 0.1% | 0.1% |
Source: Mid-America Regional Council (MARC), based on 2004 US Census Data
Source: Mid-America Regional Council (MARC), based on 2004 US Census Data
For more information see Mid-America Regional Council (MARC) Metrodataline and Regional Snapshot